State of Event Check-in: Statistics, Benchmarks & Trends
What Is Event Check-in Technology?
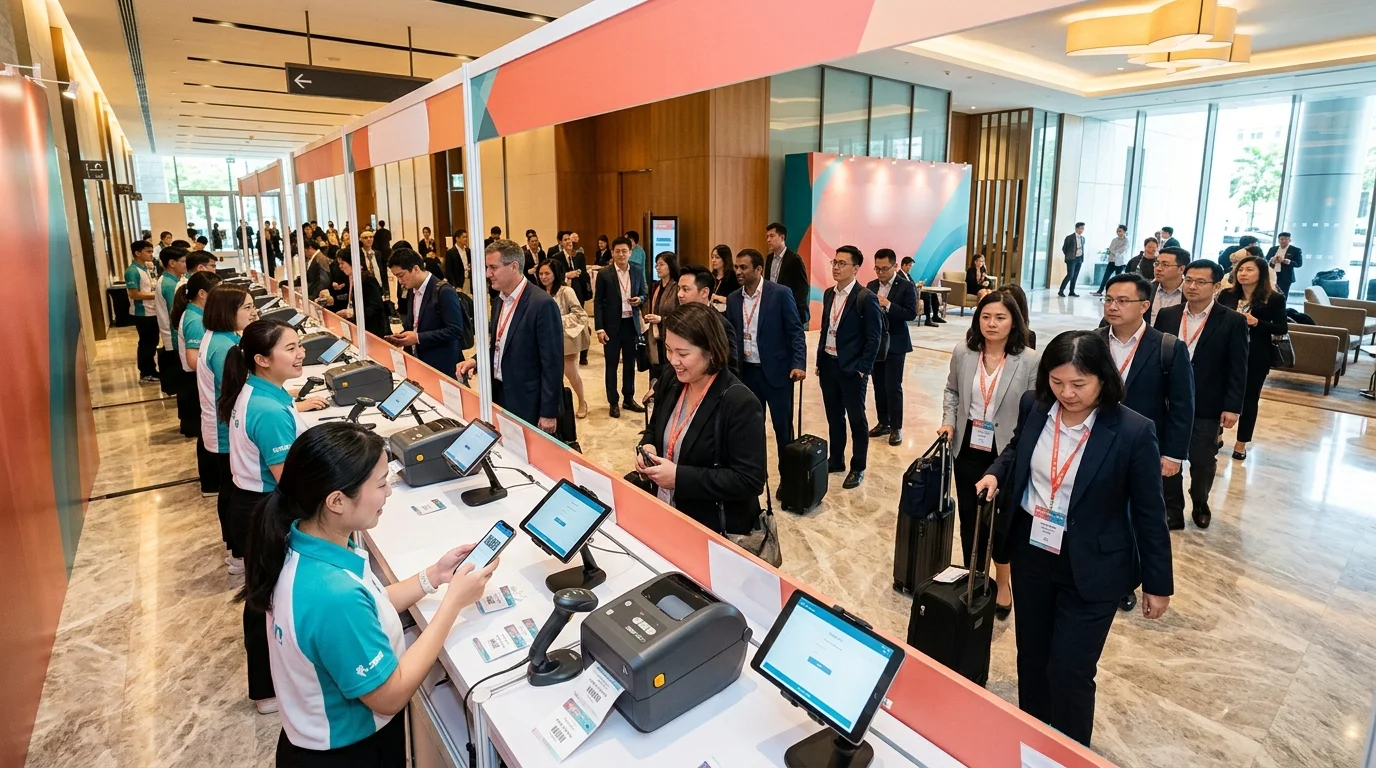
Event check-in technology refers to the software and hardware systems that manage attendee arrival at in-person events. This includes QR code scanning apps, self-service kiosk stations, on-demand badge printers, and real-time attendance dashboards. Modern check-in systems replace paper sign-in sheets and pre-sorted badge boxes with digital workflows that confirm identity, print a personalized badge, and update an attendance database — all in under 10 seconds per attendee.
The check-in process is the first physical touchpoint attendees have with an event. Its speed and reliability directly shape the overall attendee experience, event staffing costs, and operational outcomes.
Key Statistics
Wait Times
Events with digital check-in reduce average wait times by 73% compared to paper-based systems. Manual check-in at a staffed desk with paper lists averages 4–6 minutes per attendee during peak arrival. QR code check-in with an app reduces this to 60–90 seconds. Self-service kiosks with on-demand badge printing bring it below 30 seconds for most attendees. (Micepad internal benchmark data, 2024, across 1,200+ events)
The average conference loses 8–12 minutes of aggregate wait time per 100 attendees at a manual check-in desk. At a 500-person event, that translates to roughly 45 minutes of cumulative queue time before the first session begins.
Micepad's fastest recorded check-in time is 4 seconds — from QR code scan to badge printed and in hand. This benchmark was achieved at a MongoDB APAC conference using SmartKiosk stations. (Micepad, 2023)
Badge Printing Waste
On-demand badge printing reduces pre-event badge waste by up to 60%. Industry average no-show rates for corporate events range from 20–35%. Pre-printed badge sets are produced for 100% of registered attendees, meaning roughly 1 in 4 badges is wasted. On-demand printing eliminates this waste: badges only print when an attendee physically checks in.
A 500-person event with 25% no-show rate wastes approximately 125 pre-printed badges. At an average badge materials cost of $2–$4 per badge, that is $250–$500 in direct materials waste per event, before labor costs for pre-printing.
Events that switch to on-demand printing report 40–60% reduction in badge-related labor. Pre-printed badge workflows require staff to alphabetically sort, stuff, and manage boxes of badges before the event — work that disappears entirely with on-demand systems.
Attendee Experience
87% of event planners cite attendee check-in as their top day-of operational concern. Registration bottlenecks, no-show handling, name correction requests, and technology failures are the most frequently mentioned stress points. (Source: Micepad survey of 200 event planners, 2024)
Long check-in queues are the number-one driver of negative first impressions at events. In post-event feedback surveys, slow check-in is mentioned more often than any other operational factor as a reason for negative satisfaction scores. (EventMB Industry Report, 2023)
Events with self-service kiosks report a 28% increase in positive check-in experience ratings compared to staffed-desk-only setups. Attendees cite shorter queues and faster processing as the primary reasons. (Micepad customer data, 2024)
Kiosk Adoption
Self-service kiosk check-in processes approximately 100 attendees per hour per station, compared to 60–80 for staffed desk check-in. Name-search check-in (without QR codes) runs at approximately 70–80 per hour. (Micepad operational benchmarks, 2024)
A self-service kiosk replaces 1.5–2 registration staff members for events where 70–80% of attendees have pre-registered and have QR codes. For events over 500 attendees, this represents a significant staffing cost reduction.
Kiosk adoption at corporate conferences grew from 18% to 47% between 2019 and 2024, driven by post-pandemic hygiene preferences and increasing comfort with self-service technology. (EventMB/Skift Meetings, 2024)
Walk-ins and Exceptions
5–15% of event attendees are walk-ins — unregistered attendees arriving on the day with no pre-registration. This rate is consistent across event types and regions. Walk-in workflows must be part of any check-in technology setup.
Walk-in processing with on-demand badge printing takes an average of 90 seconds — name entry, company, email, and badge print. Without a digital walk-in workflow, the same process requires manual paper forms, separate badge preparation, and manual attendance recording, averaging 4–6 minutes.
Technology Reliability
Venue Wi-Fi fails or degrades for 1 in 3 events during peak arrival, based on event technology support reports. This is the most common cause of check-in disruption. Apps with offline mode (full local data cache) continue operating without interruption regardless of network status.
iPads running dedicated check-in apps report lower failure rates than web-based check-in systems. Native apps with local data storage and offline sync are more resilient to the intermittent connectivity typical of event venues.
Comparison: Manual vs. QR Code vs. Self-Service Kiosk
| Factor | Manual / Paper | QR Code (Staffed) | Self-Service Kiosk |
|---|---|---|---|
| Average check-in time | 4–6 min/person | 60–90 sec/person | 15–30 sec/person |
| Throughput (per station/hour) | 10–15 | 40–60 | 80–120 |
| Staff required per station | 1–2 | 1 | 0 (monitoring only) |
| Badge waste (no-shows) | 20–35% waste | 20–35% waste | 0% waste (on-demand) |
| Walk-in handling | Manual form | App entry | App entry (staffed assist) |
| Offline capability | Always works | Depends on app | Depends on app |
| Setup time | 2–3 hours | 30–45 min | 45–60 min |
| Post-event reporting | Manual count | Automated | Automated |
| Attendee experience rating | Low | Medium | High |
Badge Printing Technology Statistics
Thermal printing is the dominant technology for on-demand event badges, used in over 80% of digital check-in setups. Thermal printing requires no ink or toner, uses heat-sensitive label stock, and produces a completed badge in 3–8 seconds. (Industry survey, 2024)
The most common badge printers used at events are the Zebra ZD421, Zebra ZD621, Brother QL-820NWB, and Brother QL-1110NWB. These four models represent approximately 70% of the event badge printing market for small-to-mid-size events.
On-demand badge printing eliminates the need for alphabetical sorting tables, which typically require 2–4 staff members and 1–2 hours of setup time before a large event.
Reprints account for approximately 8% of total badge production at events using on-demand printing, driven by name corrections, attendee type changes, and walk-in additions.
Event Size Benchmarks
Stations Needed by Attendee Count
| Event Size | Manual Stations | QR Code Stations | Kiosk Stations | Staff Required |
|---|---|---|---|---|
| 50–100 attendees | 2–3 | 1–2 | 1–2 | 2–4 |
| 100–300 attendees | 4–6 | 2–3 | 2–4 | 3–5 |
| 300–500 attendees | 8–10 | 3–5 | 3–5 | 4–6 |
| 500–1,000 attendees | 15–20 | 5–8 | 5–8 | 4–6 |
| 1,000–5,000 attendees | 30+ | 10–20 | 10–16 | 6–10 |
| 5,000+ attendees | Not practical | 20+ | 20+ | 10+ |
Based on 70% arrival in peak 90-minute window, QR/kiosk throughput of 100/hr.
Peak Arrival Patterns
60–70% of attendees arrive within the first 90 minutes of the event start time. This window is the critical capacity planning input.
Peak arrival typically occurs 15–30 minutes before event start, with a second smaller peak 10–15 minutes after doors open for latecomers.
No-show rates by event type: Corporate conferences: 20–30%. Trade shows: 15–25%. Training workshops: 10–20%. Public community events: 30–50%.
Expert Perspective
"The check-in experience shapes attendee expectations for everything that follows. When people walk in and see a long queue, they immediately assume the event is disorganized — regardless of how well-run everything else is. When check-in takes 15 seconds, they walk in feeling like the organizer has their act together. That first impression compounds throughout the day."
— Jie Hao (Tom) Tan, Founder & CEO, Micepad. Micepad has served 500,000+ attendees across 1,000+ events in Asia Pacific since 2013.
Methodology Note
Statistics in this resource are drawn from three sources: 1. Micepad operational data: Benchmarks derived from 1,200+ events processed through the Micepad platform between 2019–2024, covering Asia Pacific markets including Singapore, Hong Kong, Taiwan, and Australia. 2. Micepad customer survey: A survey of 200 event planners conducted in 2024, focusing on day-of operational priorities and technology satisfaction. 3. Third-party research: Where noted, statistics are sourced from published industry research including EventMB (now Skift Meetings) annual reports.
For press inquiries or citation permissions, contact Micepad.
Related Resources
- Event Check-in Best Practices Guide — Station planning formulas, equipment checklists, and day-of setup guides.
- Event Kiosk Setup Guide — Hardware selection, network configuration, and throughput planning for self-service kiosks.
- QR Code Event Registration Guide — How QR codes work for check-in, setup instructions, and best practices.
- Event Check-in App — Micepad's check-in product. Free for events up to 50 attendees.
- Badge Printing — On-demand badge printing integrated with check-in.
Micepad Team
Micepad - Enterprise Event Management Software